We believe with knowledge comes confidence. So we’ve assembled a collection of timely information and expert market commentary designed to give you new insight into the ever-evolving financial marketplace to help you build the confidence that comes from being a knowledgeable investor. Bookmark this page and check back for regular updates.
Klingman Insights
February 11th, 2016
As we discussed in detail in our Q1 Capital Markets Outlook and our January 28 client conference call, there are a range of economic issues that are concerning investors today: the rapid decline in oil prices, economic slowdown in China, divergent central bank monetary policies, and the risk of a global recession. We do not believe any of these concerns rival the types of risks that we saw entering into the global financial crisis and Great Recession of 2008-09.
Also on our call, we tried to give some historical perspective on the market decline that we've experienced since May of last year. (Click here to access a recording of the call.) As the US equity market appears to be retesting the January lows again today, we thought it might be helpful to provide some additional information and historical perspective on previous stock market declines.
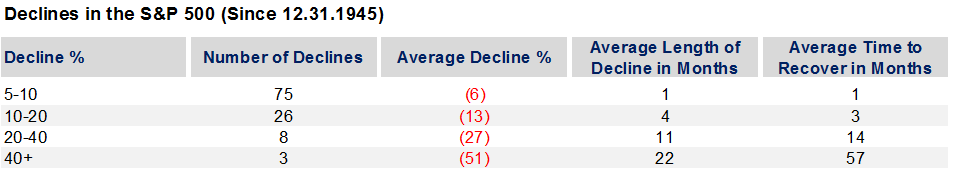
The chart below looks at stock market declines in the S&P 500 since 1945. There have been 75 different declines of 5 to 10% in the market, an average of more than one per year. The average decline was ~6%, lasted about a month, and took about a month to recover from. This is normal year-to-year market volatility.
There have been 26 "corrections" or market declines between 10 and 20%, about one every three years. The average of these declines has been ~ 13%, lasted about four months, and took, on average, three more months to recover to previous highs.
There have been 11 declines that can be categorized as "bear markets", or declines of more than 20%. The chart below further breaks those into more "normal" bear markets declines between 20 and 40%, and the extreme bear markets that we experienced in the mid-70s and 2007-2009, which saw declines of over 40%. A "normal" bear market lasts about 11 months, with an average decline of almost 30%. It has taken 14 months, on average, for the stock market to recover to its previous highs.
Let's try to frame the current decline in this historical perspective. The S&P 500 peaked on May 20, 2015. At today's levels the S&P is down about 15% from this high and is nine months into the decline. While no one has a crystal ball, and it's impossible to pick a bottom, we believe that we are much closer to the end, than to the beginning, of this decline. History does not exactly repeat, but it certainly rhymes.
Economic textbooks talk about the "equity risk premium" which essentially says that if you're willing and able to hold equities through short-term, scary periods of decline, you should be rewarded with higher long-term returns in your portfolio. It no doubt can be a very painful process to live through, particularly in an era where CNBC is blaring in the background and we have online access to all our financial information at all times. Discipline and patience are rewarded over time.
As always, if you have any specific questions related to your portfolio or plan, please don't hesitate to reach out to any of us.